See how think-cell addresses your
typical PowerPoint pain points
think-cell helps you create stunning charts in minutes, boosts your slide layoutand automates your regular reports. And all this with a single PowerPoint add-in.Here are its most awe-inspiring features.


Calendar-based Gantt charts
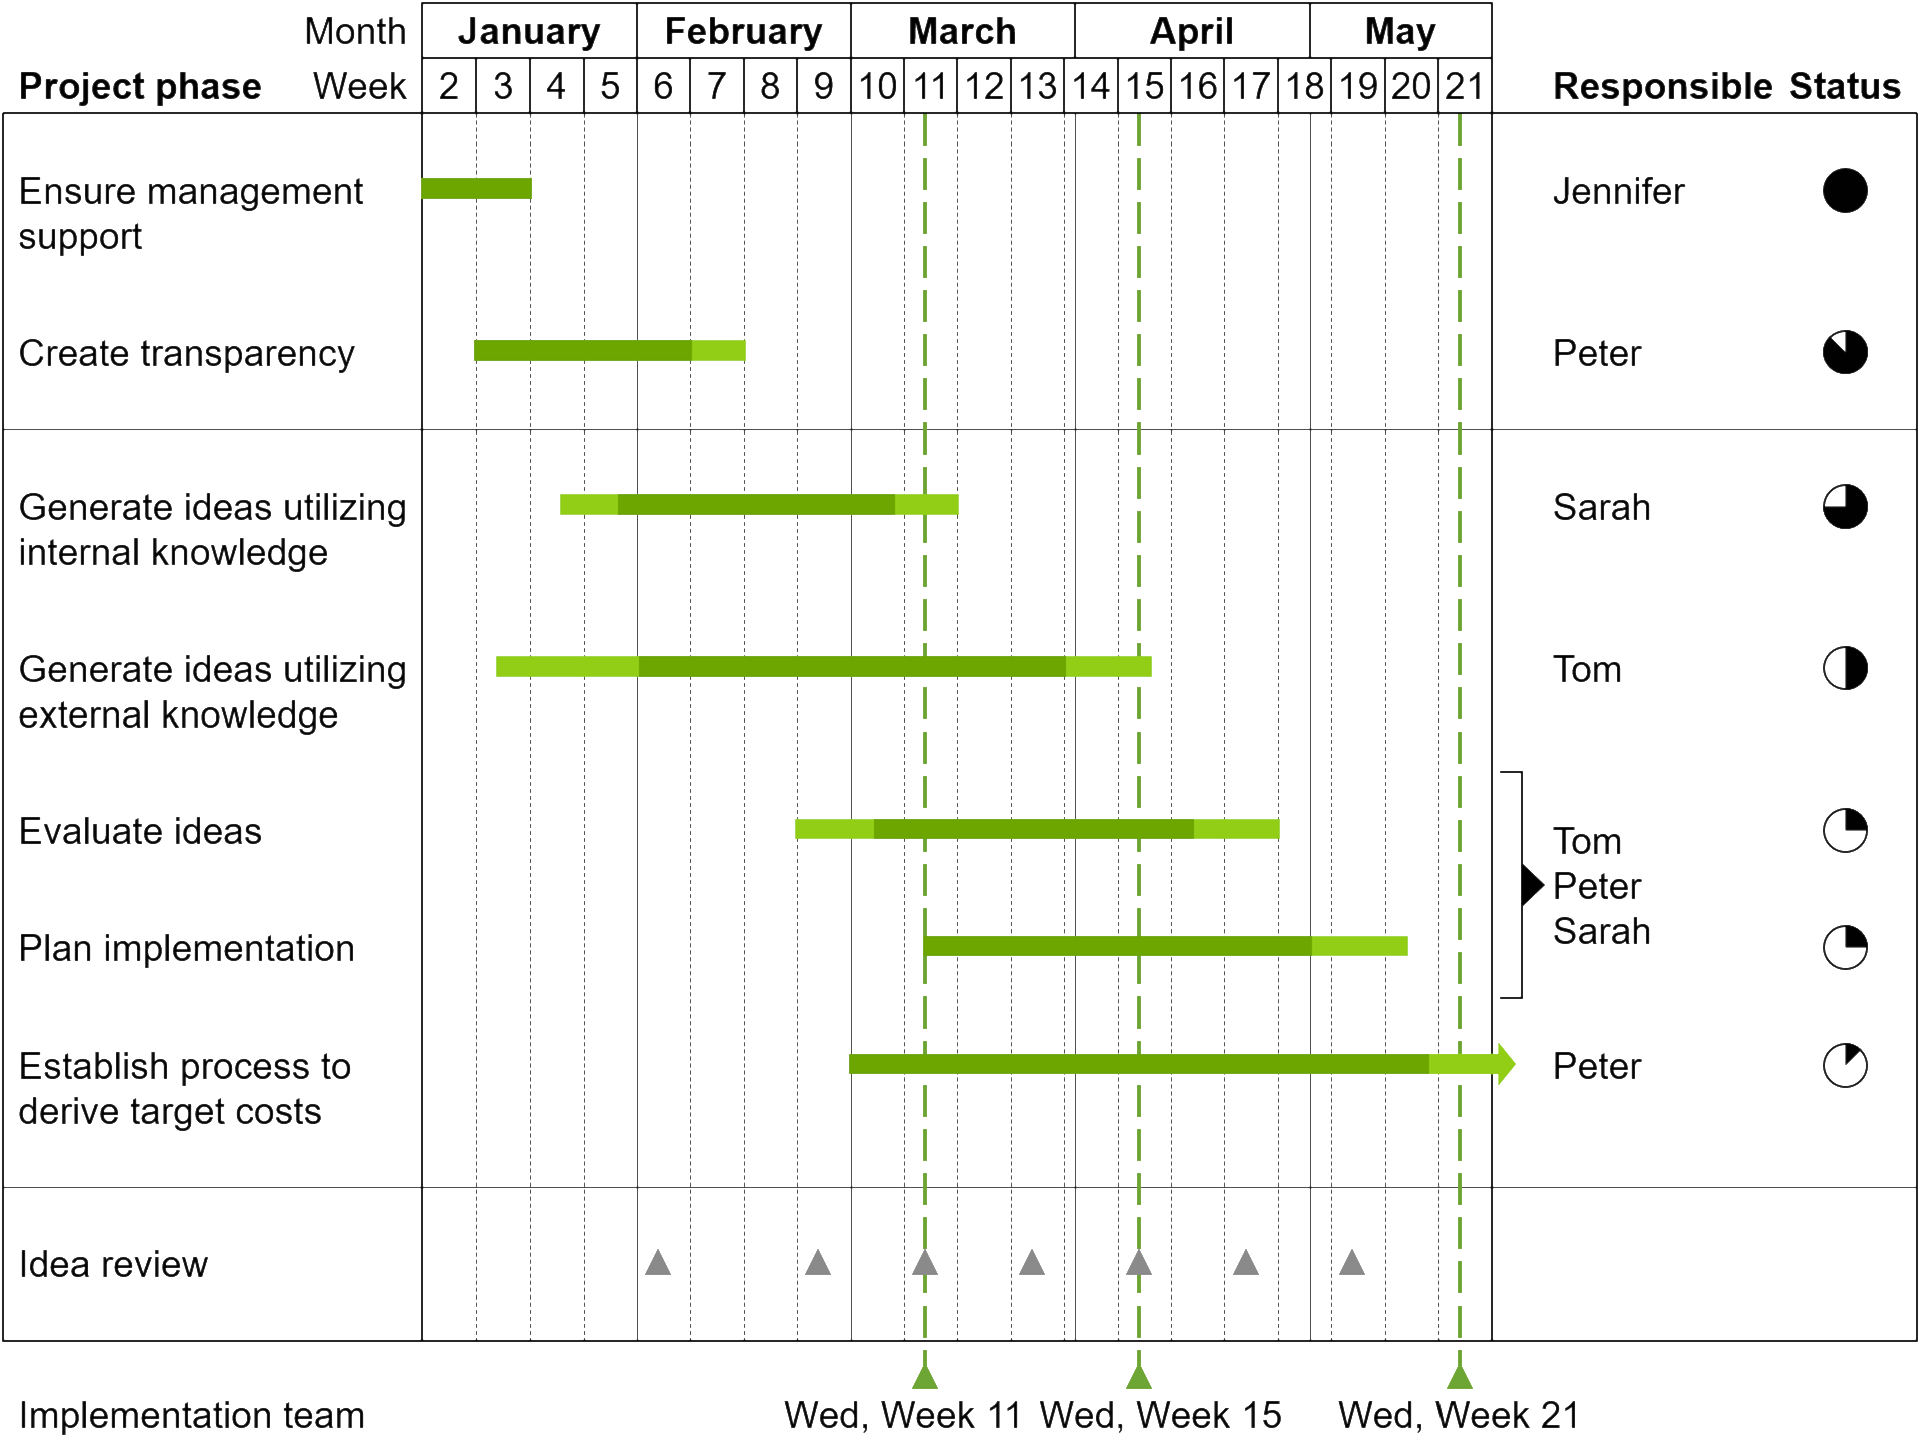
Ever tried to import a Gantt chart from Microsoft Visio or Project into PowerPoint? If yes, you knowthat this doesn't work very well. If not, you might still use basic boxes and lines to draw themyourself.
think-cell puts an end to these tedious best practices. You create and update calendar-based Gantt chartsdirectly in PowerPoint. Features such as 5- or 7-day work weeks, remark and responsibility labels ortime span brackets make sure that your work time on Gantts reduces to a few minutes instead of hours.

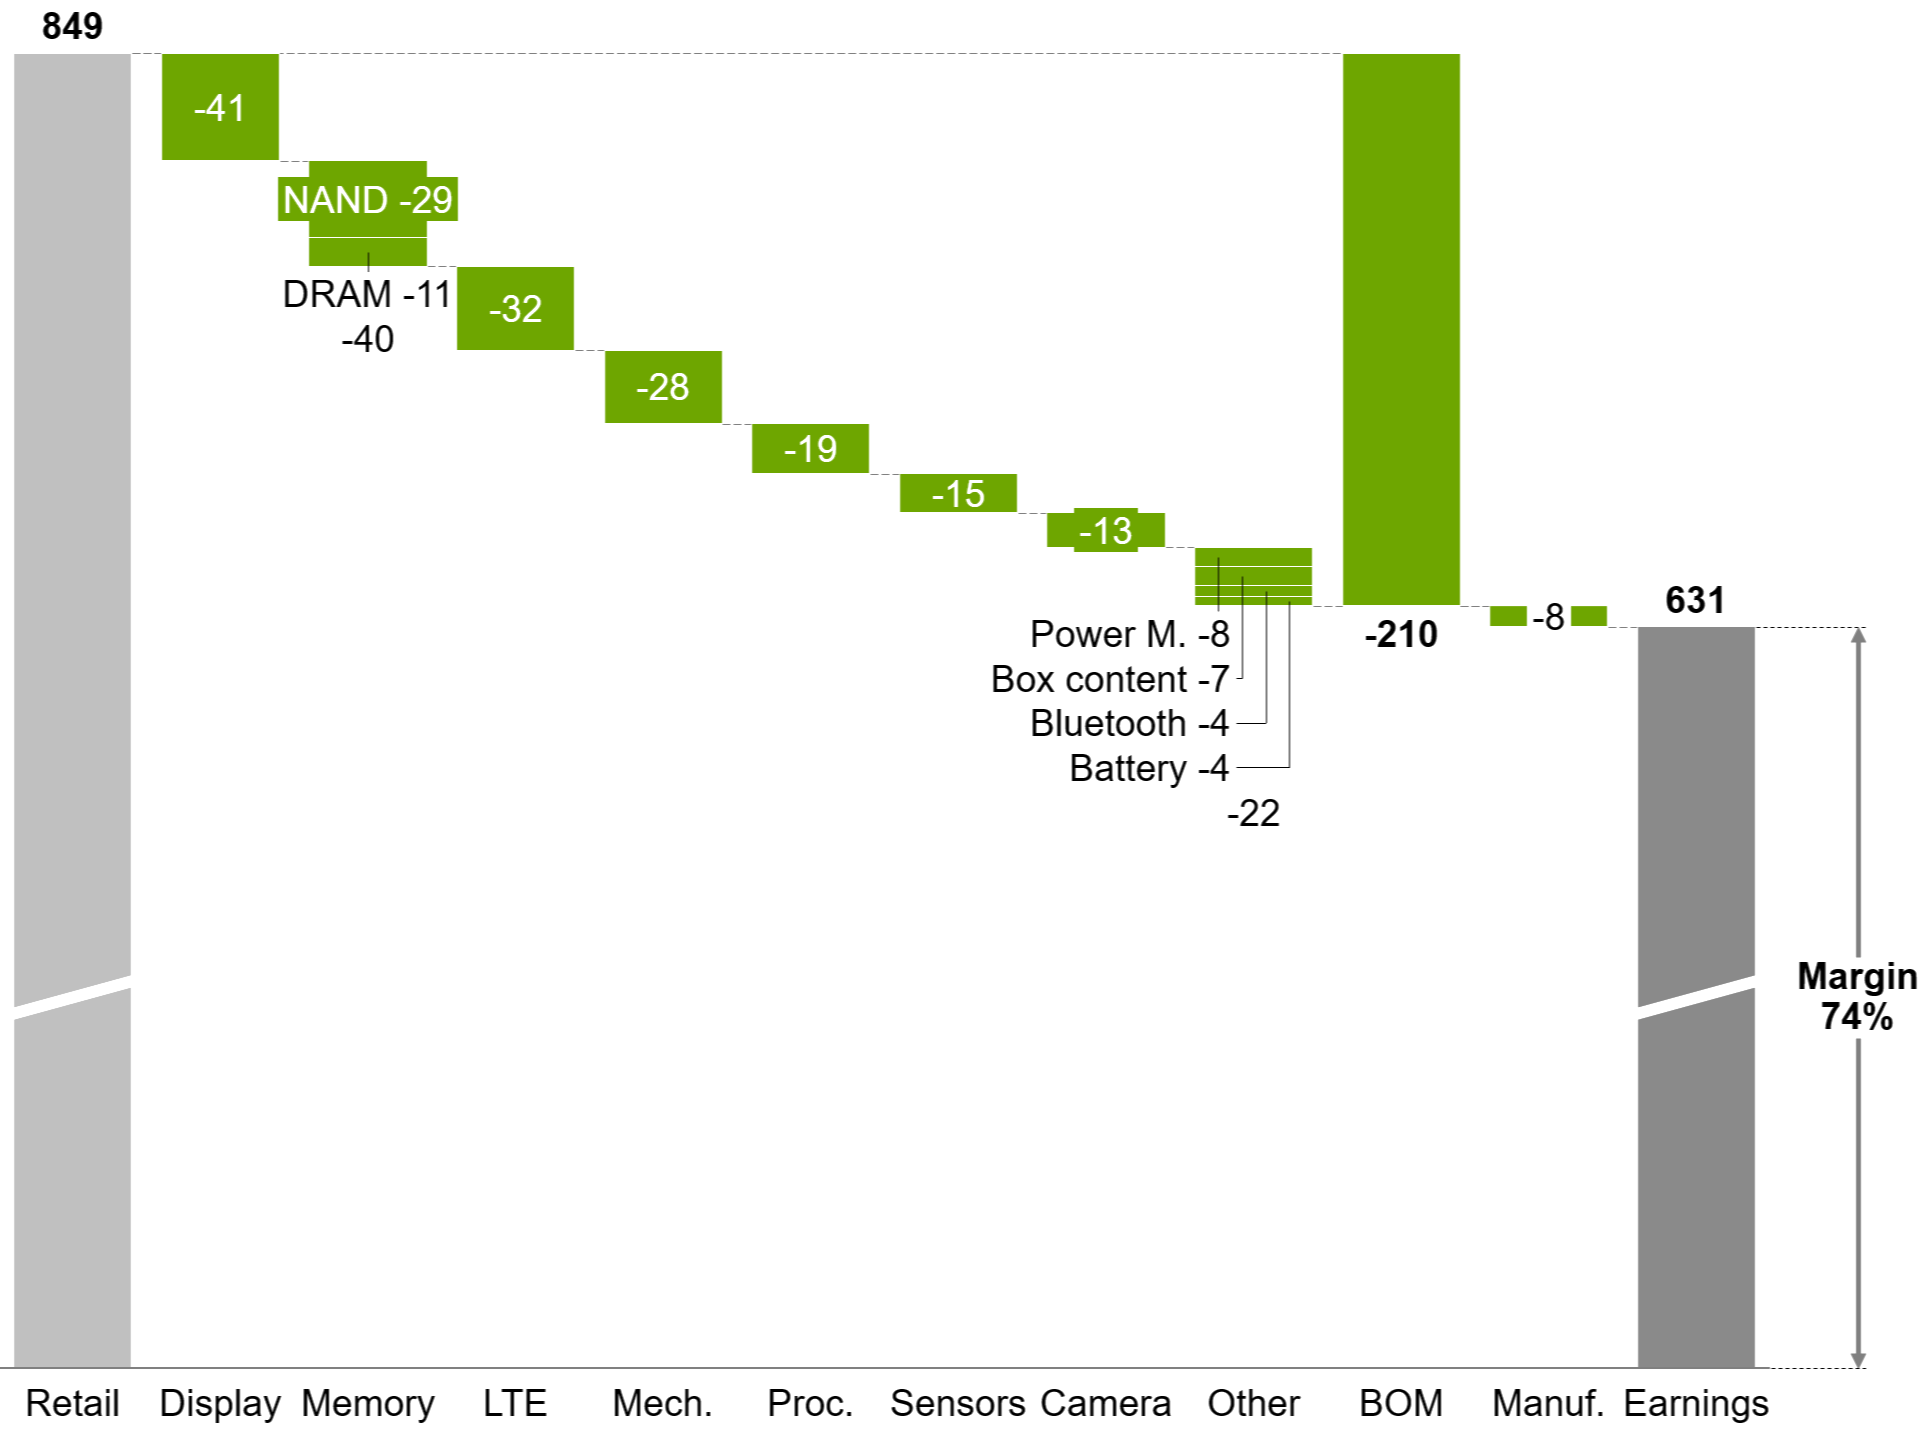
Automatic waterfall charts
Creating waterfalls in PowerPoint is time-consuming and error-prone. You either pushbasic shapes around or use a hidden data row that supports floating segments. Hence, any data changeimplies many manual calculations and adjustments.
In think-cell, positive data values in waterfalls build up, negative values build down. This worksautomatically, even for stacked segments. Segments can cross the baseline and buildupon segments in any category – not only the previous one.

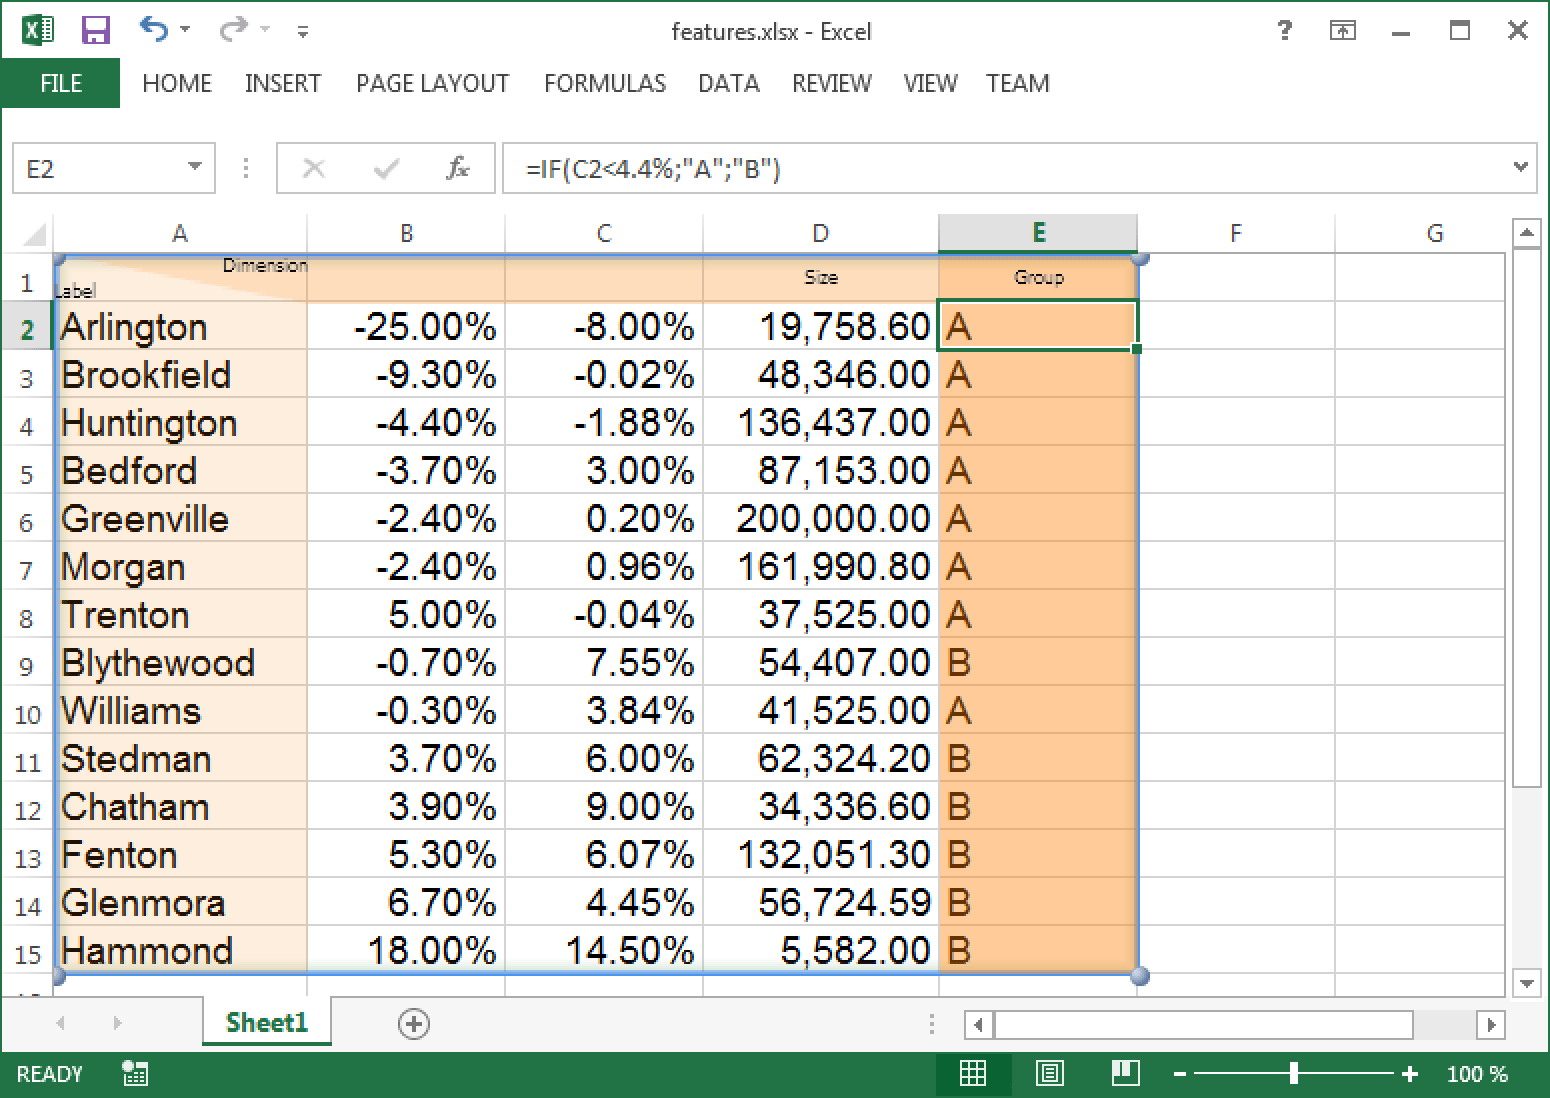
Data-driven visual annotations
Whether it be total labels, percentages, averages, breaks, difference arrows or CAGRs –think-cell will help you to tell the story behind your data by offering dozens of data-drivenvisual annotations.
And what is even better: All calculations and placements are done automatically. Your deriveddata will always be correct and labels or arrows will never overlap.
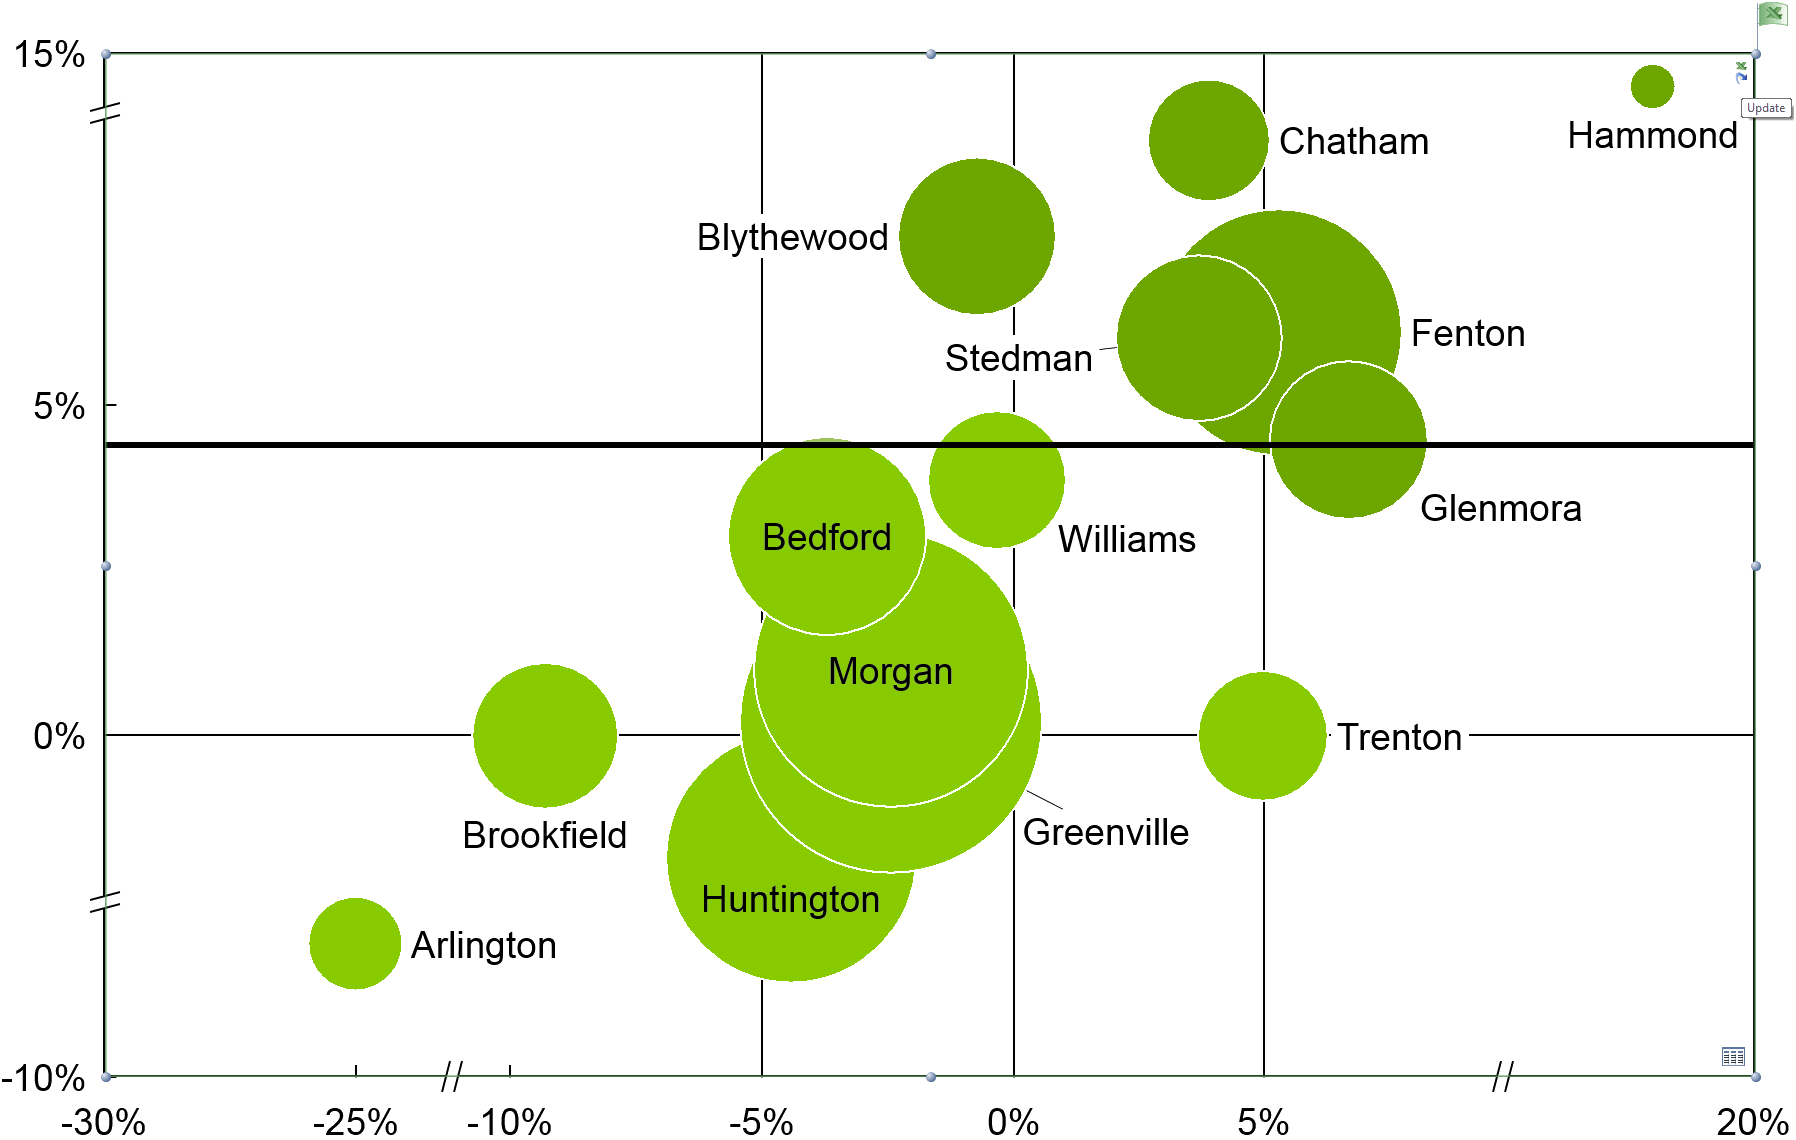
Mekko charts for complex analyses
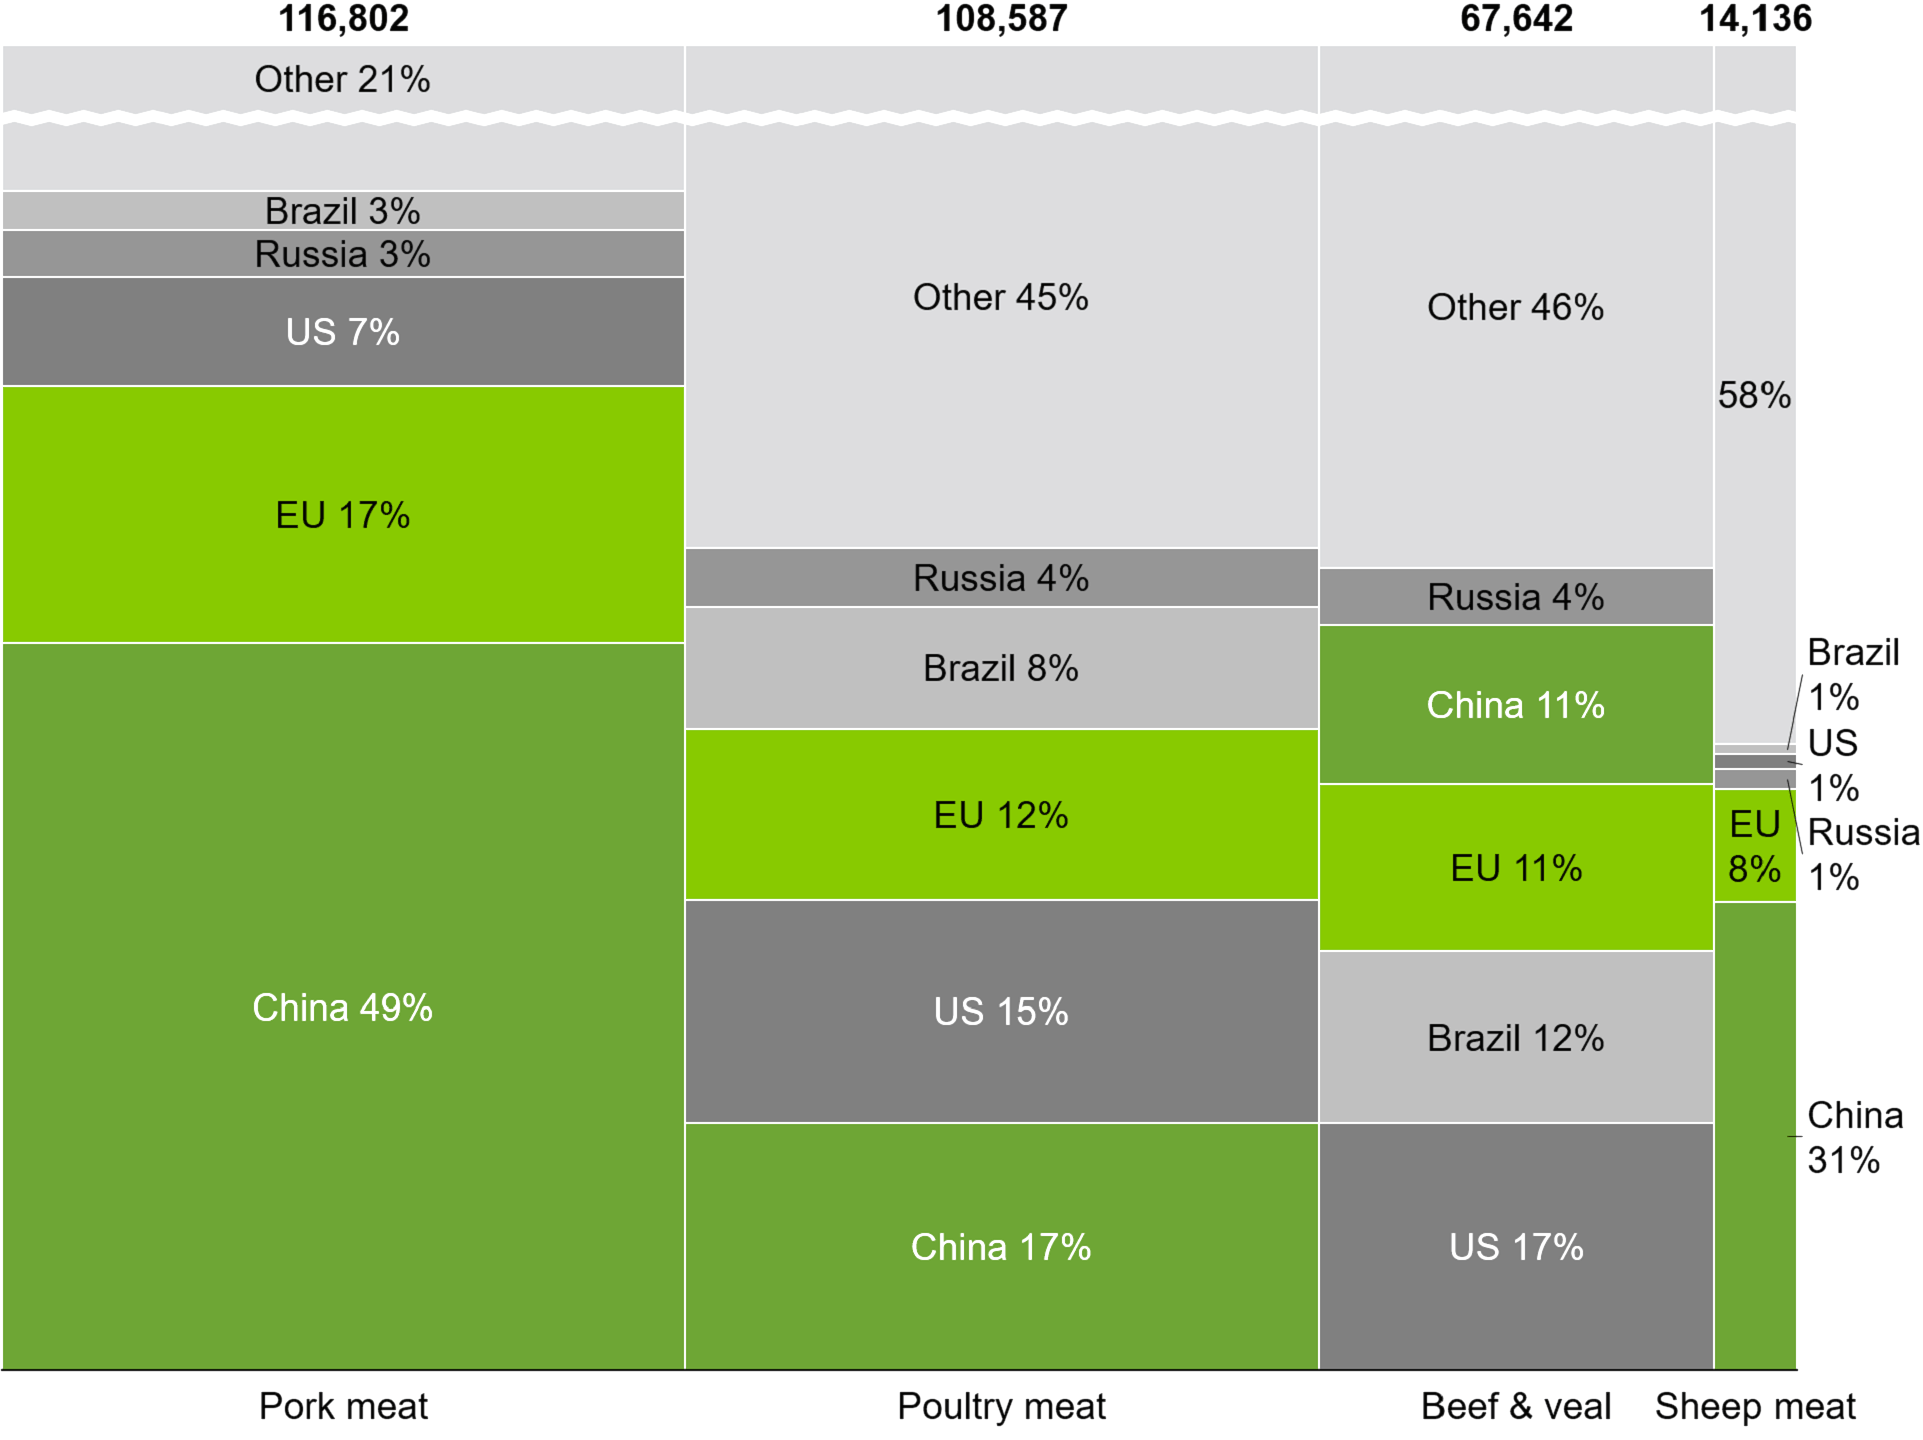
Want to show market share for different competitors and different product categories at thesame time? Why not add a second dimension to your data visualization? A Mekko (also known as Marimekko)is the perfect chart for this job.
think-cell's Mekko chart is a two-dimensional 100% chart or stacked chart. Column widthsare calculated automatically or can be provided by you. Values can be ordered by size andsmall values can be hidden in an "other" series.

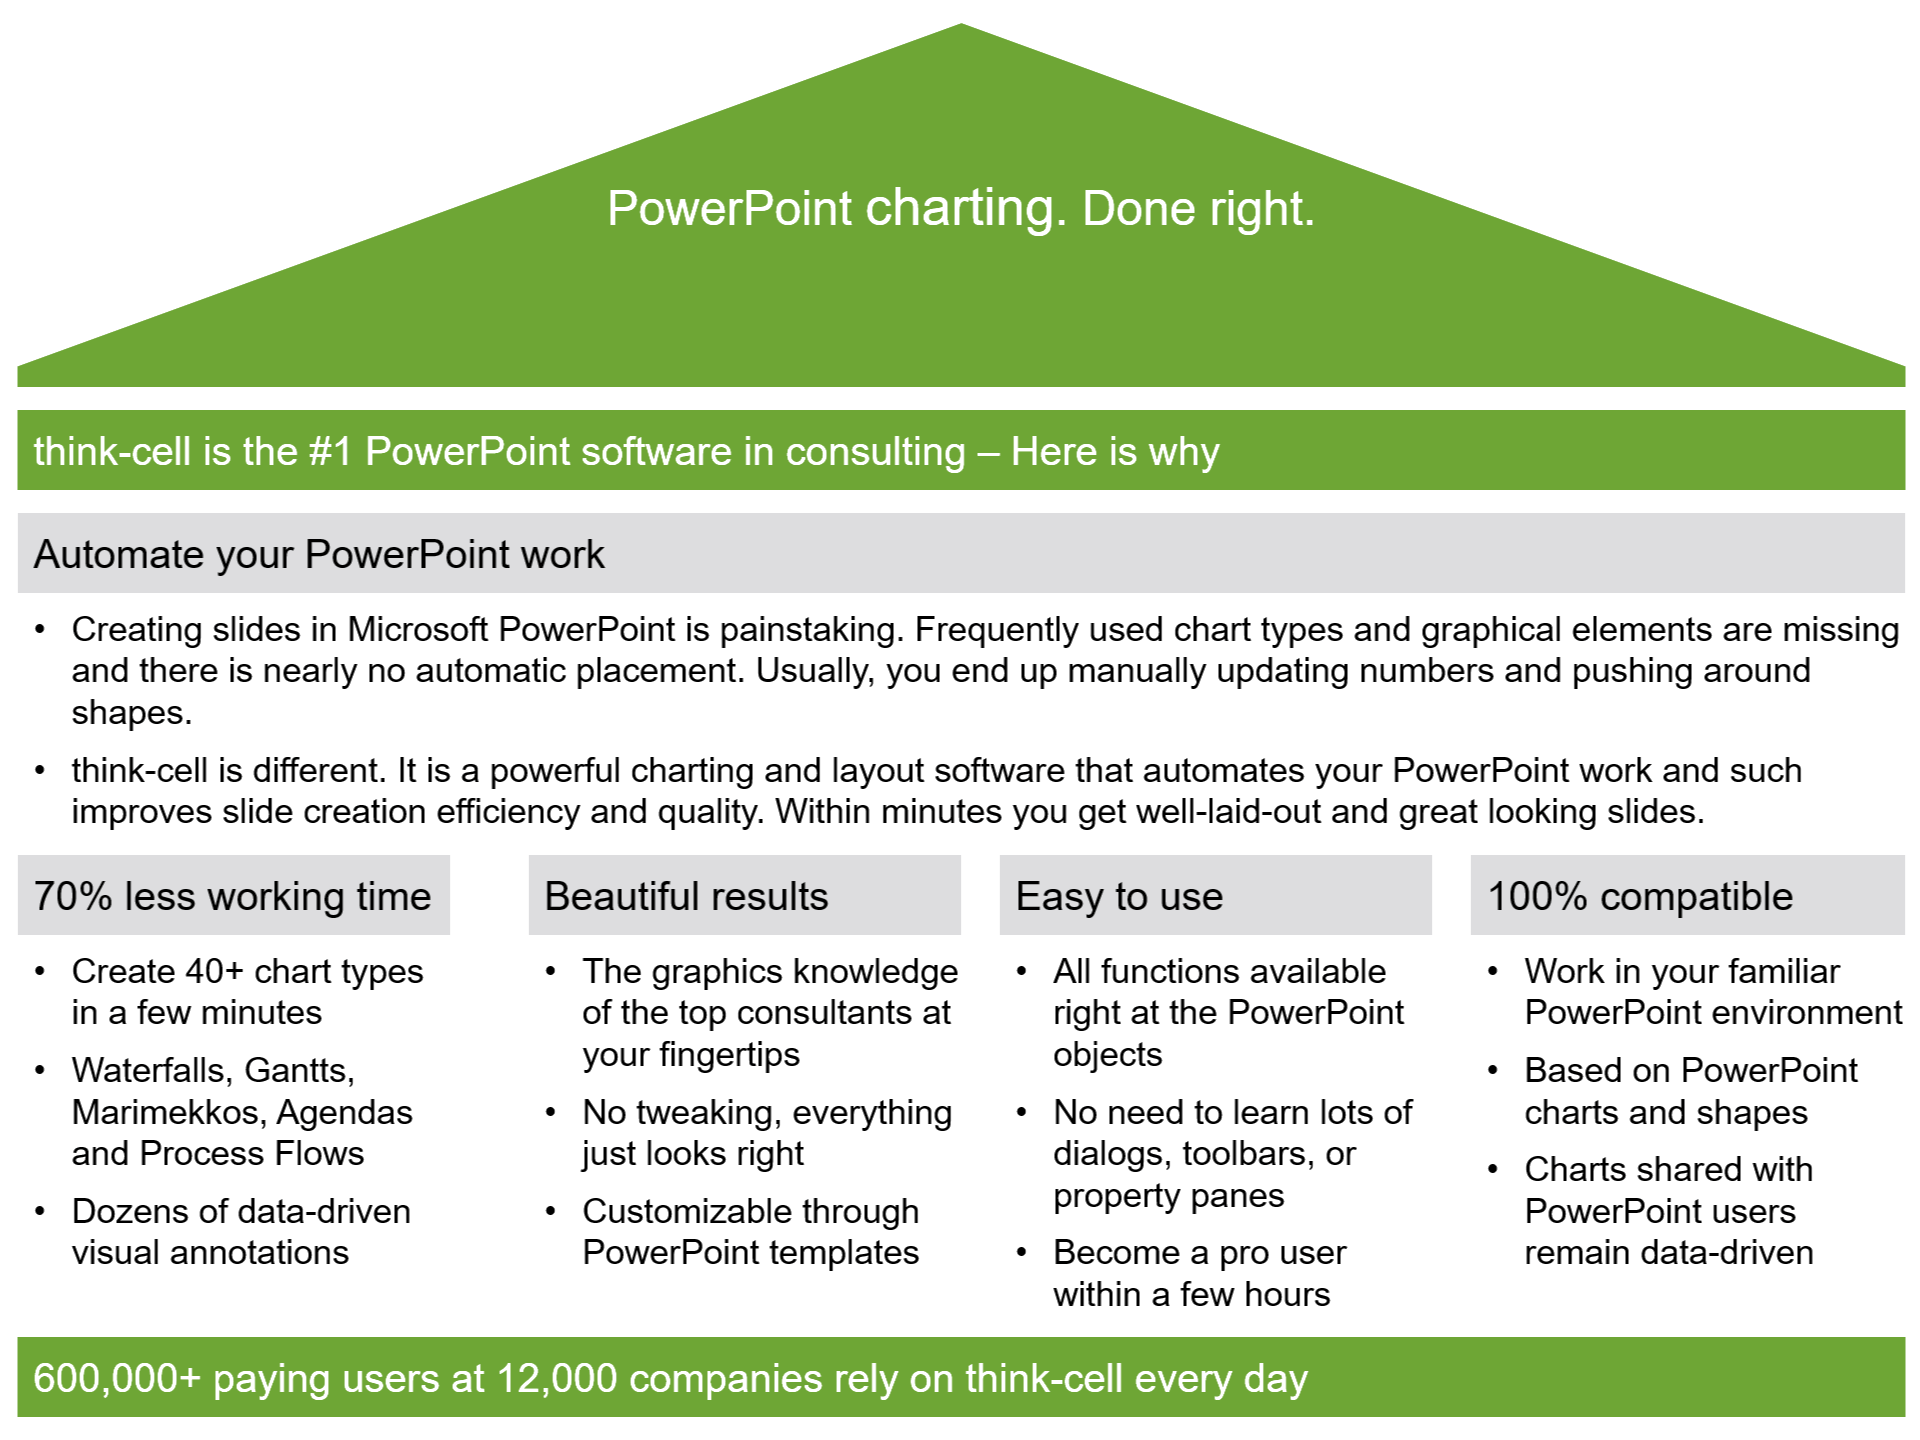
Smart text boxes
When it comes to slide layout in PowerPoint, all your options entail unsatisfactory compromises:You may use an inflexible PowerPoint table, combine standard text boxes and face many tediousmanual adjustments, or you may use a template from PowerPoint's SmartArt or your own libraryand soon bump into its limitations.
Using think-cell's smart text boxes, you can quickly build up complex slides like this one. When addingtext and other elements, the slide layout is continuously optimized automatically. Meaningfulactions like snapping together, aligning and moving elements define a smart grid so thatyou never need to place or resize shapes manually.

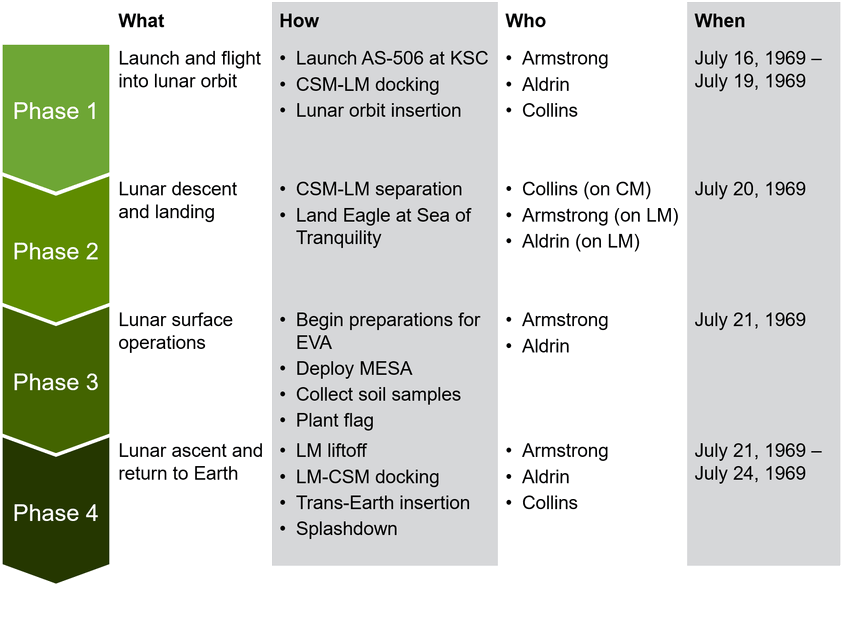
Flexible process flows
Have you ever tried building a simple process chain in PowerPoint? Are you still struggling with the rightpositioning of basic shapes or trying to combine weird SmartArt objects that never align correctly and fallapart after a few interactions?
Then meet our process flow. With it you create and change simple flows in minutes.But since it is based on a powerful generic layout engine, you are completely flexible and can build anyconceptual slide based on pentagons, chevrons and text boxes.


Automated data visualization
You spend hours and hours on updating charts in your reports every month?Cut down these hours to a few minutes!
With think-cell's data links, every chart in your presentation can be linked toExcel and updated either manually or automatically. think-cell'sprogrammatic interfaces offer even more automation. Once set up, they will create entire slide decks from your charttemplates and designated data. Periodic reporting couldn't be easier.


Data extraction from any column chart image
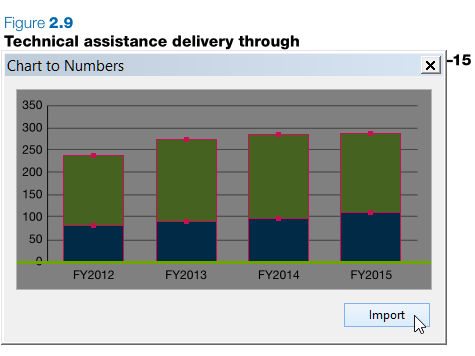
Have you recently seen a chart on a web site or in a PDF report that youwould have liked to use in your presentation? Using copy & paste in thissituation yields good visual results, but makes changes impossible. On theother hand, guessing and retyping the data underlying the chart is time-consumingand error-prone.
Using think-cell, you simply drag a transparent window over any image of acolumn chart on your screen, hit the import button and let our software do the rest. It willnot only correctly extract the data, but also the category labels and put theminto your Excel sheet. From there, a think-cell chart in PowerPoint is only one click away.


